


SLAF-seq技術
產(chǎn)品介紹
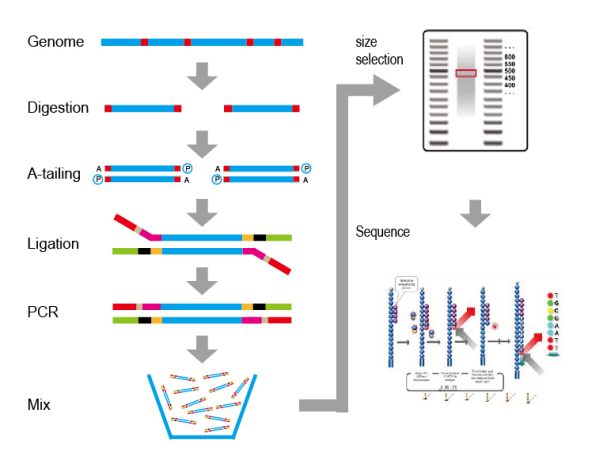
SLAF-seq is a simplified genome sequencing technology independently developed by Biomarker, which can significantly reduce the experimental cost by sequencing part of the genome sequence of species. According to the characteristics of the genome of, SLAF-seq can flexibly select restrictive endonuclease combinations for enzymatic digestion of the DNA, and then select the specific length of the enzymatic fragments for sequencing, so as to ensure a high number of developed markers and realize uniform distribution of markers in the genome at the same time.
技術原理
應用方向
SLAF-seq is a cost-effective strategy for large-scale genetic studies of animal and plant populations, and has been widely used in genetic evolution, GWAS, genetic mapping, BSA, and marker development.
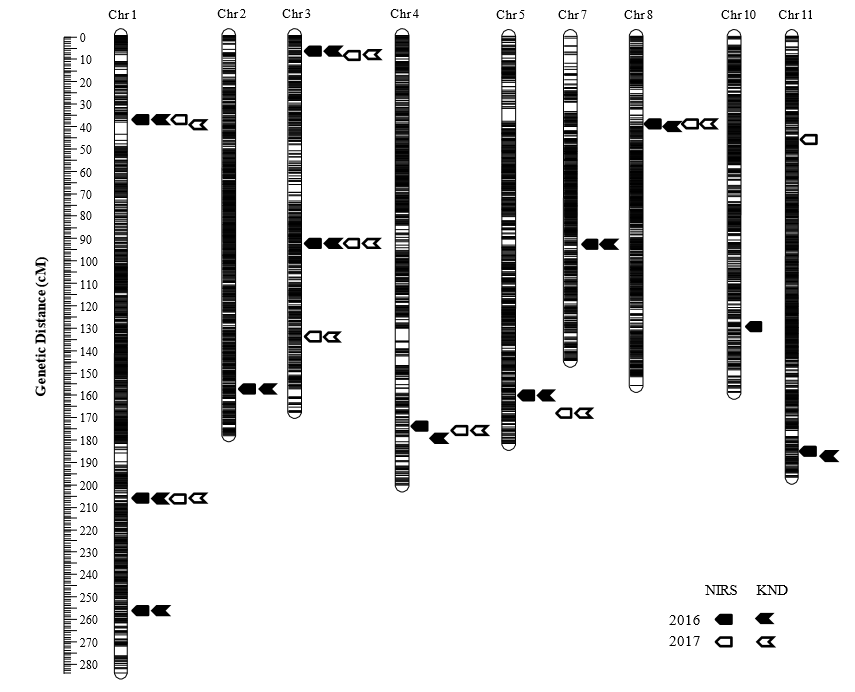
?Genetic map – showing the relative position of known genes and/or genetic markers.
High-density linkage map based on genotyping-by-resequencing showing the most likely positions of QTLs for grain protein content measured by NIRS and KND methods in population.
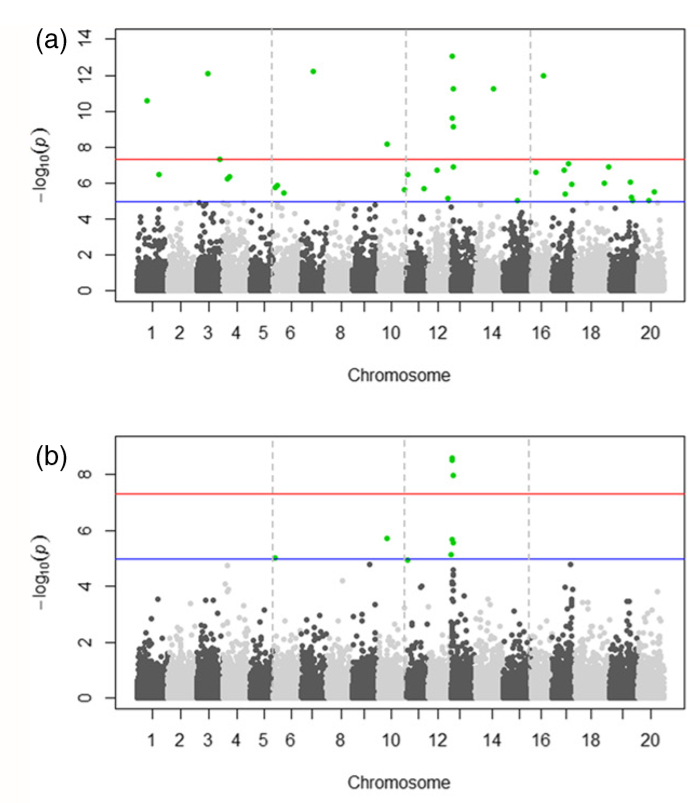
GWAS – an observational study of a genome-wide set of genetic variants in different individuals to see if any variant is associated with a trait.
The x-axis shows the single nucleotide polymorphism (SNPs) along each chromosome; the y-axis is the –log10(P-value) for the association. Genome-wide P-values from the generalized linear model (GLM) and compressed mixed linear model (CMLM). Colored dots in (a) and (b) indicate SNPs with P-values < 1.99 9 106 (a < 0.05) in both models.
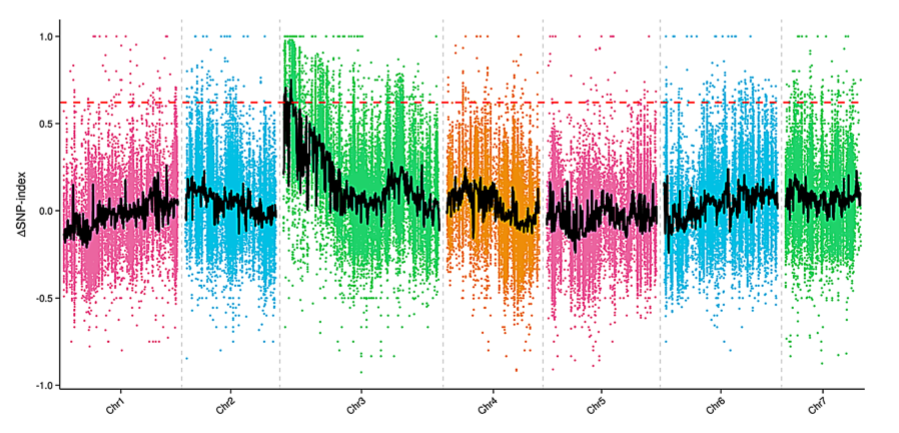
BSA – a technique used to identify?genetic markers associated with a mutant?phenotype. This allows geneticists to discover genes conferring disease resistance or susceptibility.
Δ(SNP-index) graph of MF (male fertile) and MS (male sterile) pool from the bulked segregant analysis (BSA). The X-axis represents the chromosome position. The Y-axis represents the Δ(SNP-index) value. The spots represent Δ(SNP-index) values calculated by the formula: [Δ(SNP-index)?=?SNP-index_Largest-SNP index_Smallest]. The black line corresponds to the fitted value of the Δ(SNP-index) and the red line represents the confidence value (99%).
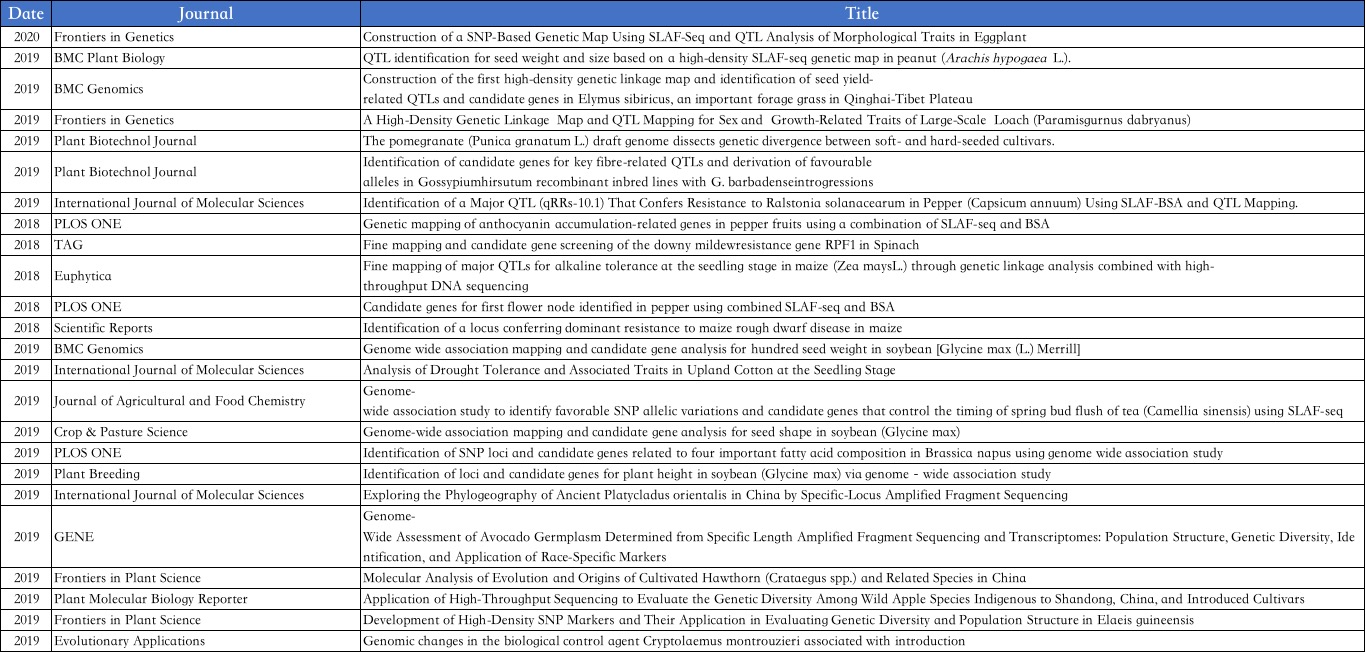
成功案例


Copyright ? 2009-2025 北京百邁客生物科技有限公司版權所有 京ICP備10042835號
 京公網(wǎng)安備 11011302003368號-網(wǎng)站地圖
京公網(wǎng)安備 11011302003368號-網(wǎng)站地圖